





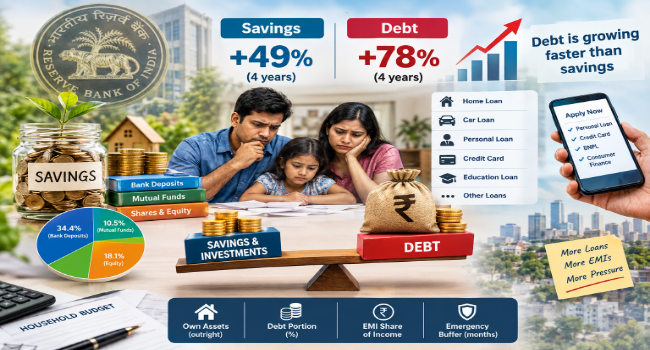
There was a time when a family’s financial strength was measured simply by how much money it had in the bank, how much it had saved, and how many assets it owned. Today, however, another metric has become equally important: how much debt that family carries. This is not because Indian households have stopped saving — they continue to save, and they continue to invest. But their debt is now growing faster than their savings. Four years ago, for every ₹100 of financial savings an Indian household held, it carried roughly ₹27 in debt. That figure has now climbed to ₹32, indicating that the share of debt within household financial security is rising — a trend now drawing concern from economists and policy watchers alike.
RBI Data: Assets and Liabilities
The Reserve Bank of India’s latest data makes this shift clear. As of March 2026, the total value of financial assets held by Indian households stood at ₹490.3 lakh crore, equivalent to roughly 141.6 percent of the country’s GDP. At the same time, total household financial liabilities — loans and debts combined — stood at ₹158.5 lakh crore, or 45.8 percent of GDP. These figures cover financial assets only; physical assets such as housing, land and gold are not included, meaning total household wealth is likely higher than the reported numbers suggest.
The underlying concern is not a decline in assets, but the fact that liabilities are growing at a faster pace. Across the 16 quarters between June 2022 and March 2026, household debt in India rose by 78 percent, while financial savings over the same period grew by only 49 percent — meaning household debt has outpaced the growth of household savings.
Where Households Are Investing
The RBI clarified that Indian households have not stopped saving; rather, while the value of household financial assets has risen, liabilities have risen even faster. A shift is also evident in where households are placing their money. As of March 2026, bank deposits remained the largest component of household financial assets at 34.4 percent, down from 36 percent in June 2022. Over the same period, the share held in mutual funds rose from 6.4 percent to 10.5 percent, while direct equity investment fell from 20.1 percent to 18.1 percent. Combined, shares and mutual funds now account for roughly ₹29 of every ₹100 of household financial savings, reflecting a growing exposure of household wealth to market performance — a factor that ties household wealth more closely to market fluctuations.
Drivers of Rising Debt
Analysts point to several factors behind the rise in household borrowing. Expenses have increased across housing, education, vehicles, healthcare and lifestyle spending, while access to credit has simultaneously become far easier. Where households once needed to visit a bank branch to secure a loan, personal loans, credit cards, Buy Now Pay Later schemes and consumer financing are now available within a few clicks on a mobile phone, increasing households’ ability to spend ahead of their income.
To illustrate, a middle-class household with a combined monthly income of ₹60,000 might carry a home loan EMI of ₹20,000, a car loan EMI of ₹10,000, a personal loan EMI of ₹7,000, and a credit card bill of ₹5,000, alongside school fees, rent and other expenses — leaving a large share of income committed to fixed obligations before it is even received. Experts caution that the risk lies not in taking a single loan, but in the pattern of taking one loan to repay another: an unpaid credit card balance accrues interest, is settled through a personal loan, which raises the EMI burden, while renewed household expenses push the credit card back into use — beginning a cycle of recurring debt.
RBI figures show personal loans have grown sharply in scale. In March 2022, outstanding personal loans issued by scheduled commercial banks stood at approximately ₹34.7 lakh crore; by March 2026, this had risen to nearly ₹69.4 lakh crore, spanning housing loans, vehicle loans, education loans, gold loans and other personal lending categories.
A Note of Perspective
The RBI has stressed that this data does not indicate Indian households as a whole are sinking into dangerous levels of debt. According to the 2026 Financial Stability Report, India’s household debt relative to GDP remains lower than that of several other emerging economies, suggesting that while household debt is rising domestically, the situation has not reached an alarming level by international standards.
Nonetheless, the trend identified in the RBI’s data remains significant: savings are rising, but debt is rising faster. This means even households that appear financially comfortable today need to assess how much of their income is already committed to EMIs — a challenge increasingly facing India’s middle class.
Salaries have risen, but so has the cost of housing. A new home requires a loan; a new car requires a loan; children’s education often requires a loan; emergency expenses are increasingly met through credit cards; and entertainment, gadgets and travel are frequently financed through EMIs. This pattern of borrowing and spending creates an appearance of rising prosperity even as debt accumulates in parallel. Over the past four years, savings grew by 49 percent while debt grew by 78 percent — a gap experts describe as the clearest warning sign in the data.
Analysts say that what ultimately determines a household’s financial health is not the total wealth it holds, but how much of that wealth is genuinely owned outright, how much is tied to debt, what proportion of monthly income goes toward EMIs, and how many months a household could sustain itself without additional borrowing in the event of an emergency.
The central message from the RBI’s data, according to economists, is that Indian households are saving and investing, but accumulating debt at an even faster rate. Should this trend persist, many households are likely to face increased financial strain, with experts advising that limiting unnecessary expenditure remains among the most effective ways to manage the growing debt burden.